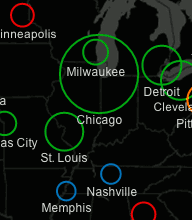
This map
Las Vegas, it appears, carries less cultural weight than nearby Los Angeles. Meanwhile, Boston, having ceded its dominant role in American literary life nearly a century ago, continues to hold its own: with barely 300,000 people, it still looms larger in the language than LA. But more than anything, this map shows the enduring dominance of New York City, towering over the cultural landscape in a way that the map, with its pseudo-logarithmic scale can’t even do justice to. Were these letters written according to a more ordinary geometric scale (making Tucson visible to the naked eye) New York would blot out the entire Eastern Seaboard. And though it also proved impossible to show, for most of the 19th century Brooklyn appeared as often as Manhattan. That may in part have been on account of people simply referring to Manhattan as New York.
The map also reveals the unsurprising geography of America’s cultural development. New England had pride of place in the late 19th century, not only cities associated with the era’s high culture like Boston and Hartford (where Mark Twain moved in his later life) but also, say, Pittsburgh. Portland, Oregon’s prominence in this period is most likely the result of its post gold rush high, combined, one suspects, with the fact that its east coast eponym was also enjoying a period of maritime relevance at the time.
Confirming what everyone suspected, interest in the South peaked during the Civil War, with cities like Richmond, Savannah, Nashville and Charleston getting more mentions during the war or shortly thereafter than at any time since. Even Atlanta, one of the few Southern cities to emerge as a burgeoning cultural hub, was mentioned more the year it was burned down that at any point before the 1960s. (Bangor appears in part because it is the one of the few northern cities whose cultural influence also peaked in the 1860s. I can only assume this corresponds with the first telling of the “Bangor? Hardly even know her!” know joke.)
Omaha, Kansas City, Cleveland, and Detroit… these were the towns whose mystique and economic vitality seemed to vanish when the highways reached them. The same goes for Boise, Santa Fe, Salt Lake City and even all of Montana. Even Chicago, which sort of maintains on this map its claim to being the Second City, was never so popular as that moment in the 30s when it truly was hog butcher to the world. America’s shift westward is well-documented too, and many of the up-and-coming cities are the ones we would expect from this movement: Dallas, Minneapolis, Denver, San Francisco and Seattle.
Washington’s size proved too difficult to calculate on account of their being a state and a George with the same name, but it seems that references to Washington DC took off dramatically around the time of the New Deal, after being virtually nonexistent before, and then rose again with the expansion of the federal government in the 1970s. Needless to say, DC’s growth continues today.
The map reveals a Steinbergesque foreshortening of non-American cities, with Toronto peaking about on par with Minneapolis or Cleveland across the border. Though not on the map, London, perhaps because it is after all an English speaking country, is on par with New York for most of the century, peaking with the Beatles in 1968. Cities such as Paris, Rome and Berlin, meanwhile, rank alongside Denver or Atlanta. Moscow features briefly during World War Two and the Cuban Missile Crisis, while Jerusalem was actually more-discussed in the pious era century ago than in today’s fraught middle east.